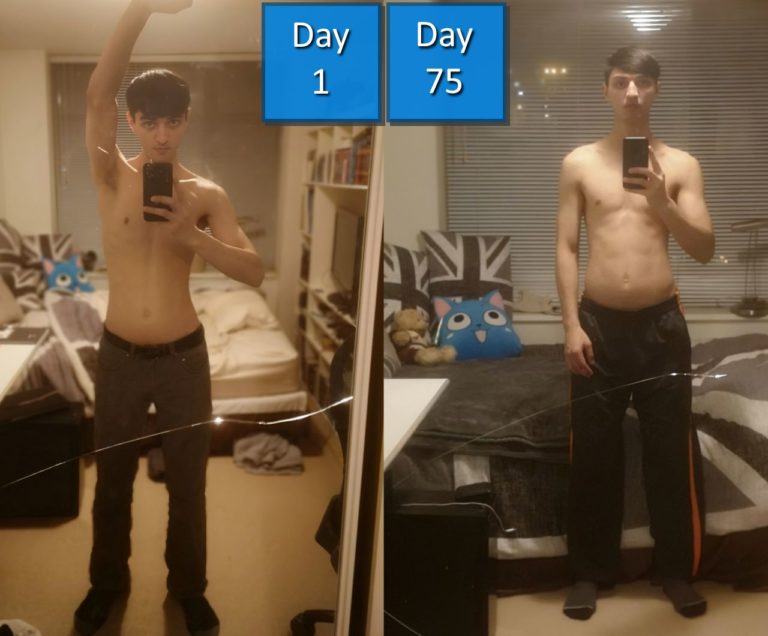
Sabian started doing a personal development challenge called 75HARD, which involved doing two 45-minute workouts.
He decided to step it up a notch, and do more and more intense workouts, keeping track of how many reps and sets he’s been doing every day.
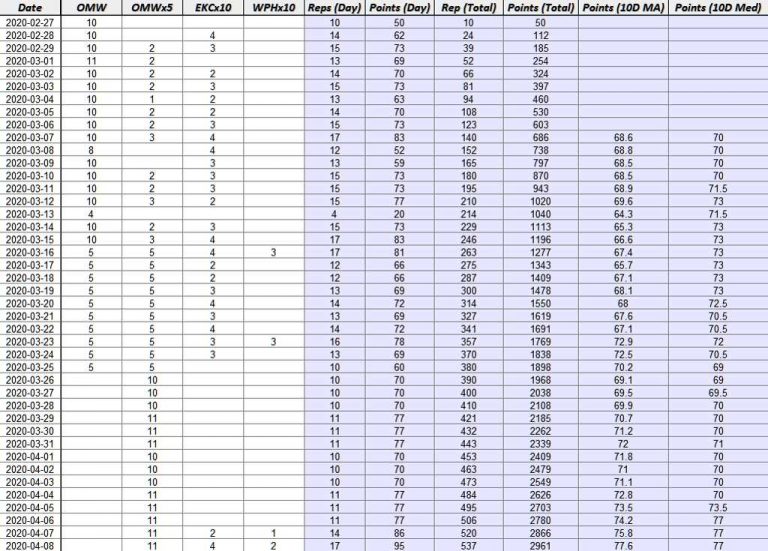
So, he started out using his phone’s notepad, but quickly realized it wasn’t sustainable, and put it all in a spreadsheet where he could do calculations.
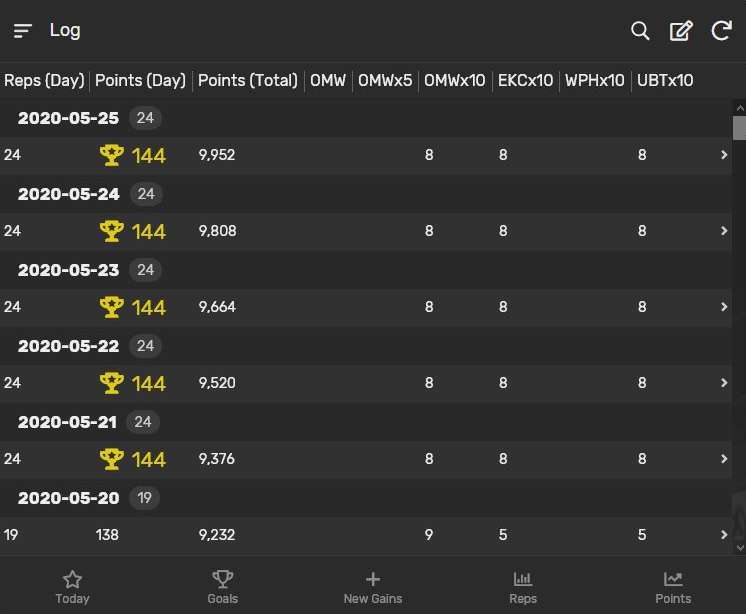
Again, he realized this was also not sustainable, and so the sheet was converted and implemented into a database to create intake forms, customize tables, generate reports, and more.
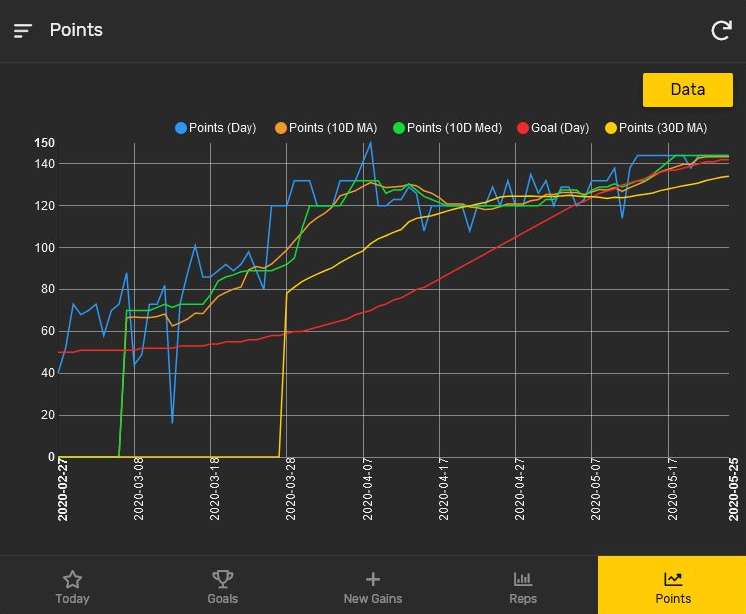
Using proper data collection, structure, and visualization tools, an interactive dashboard was created, showing all key performance indicators and growth progressio. The red line tracks the expected goal for each period. The dashboard also includes a scatter diagram to identify best performance days, and per-workout efficiency.
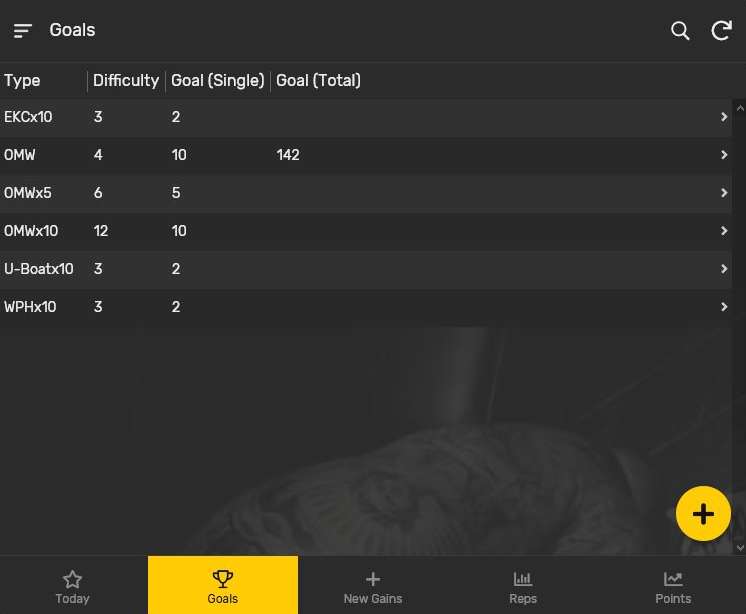
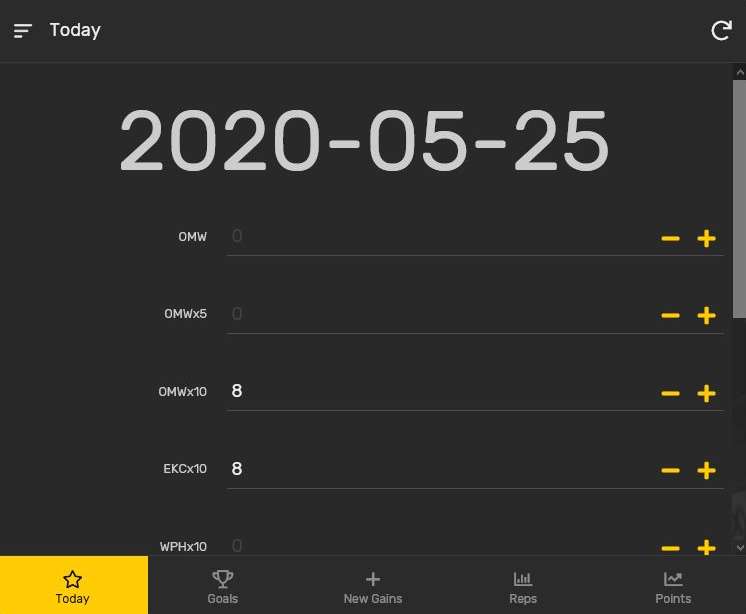
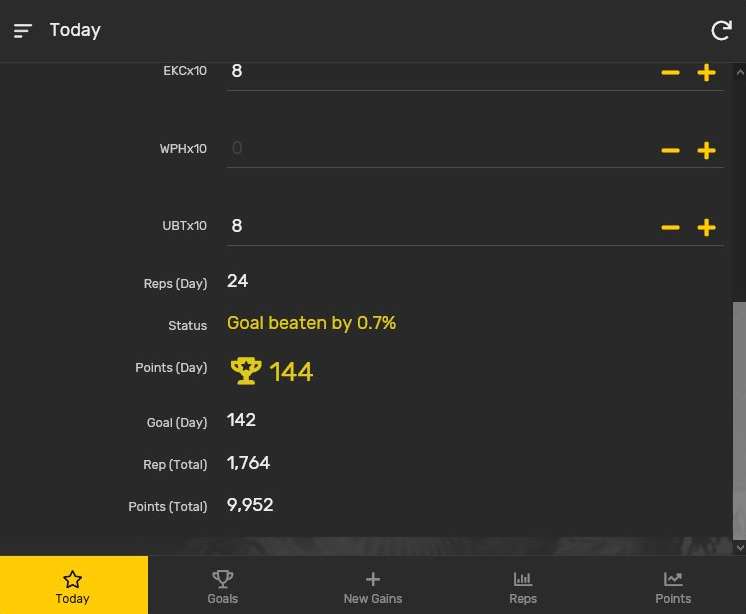
Mobile Application Expansion
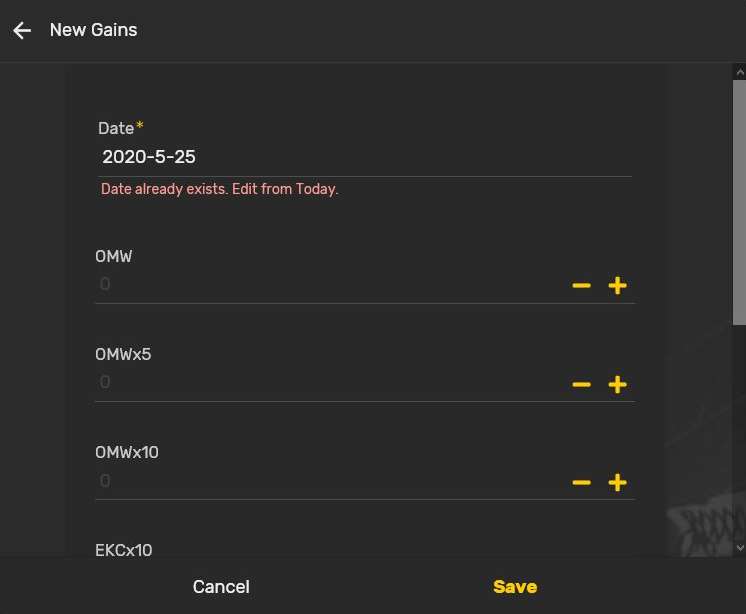
App Interface
Sabian liked the database and visualization he created, but he wanted to use and input entries from his phone, so a mobile app was developed to do exactly that.
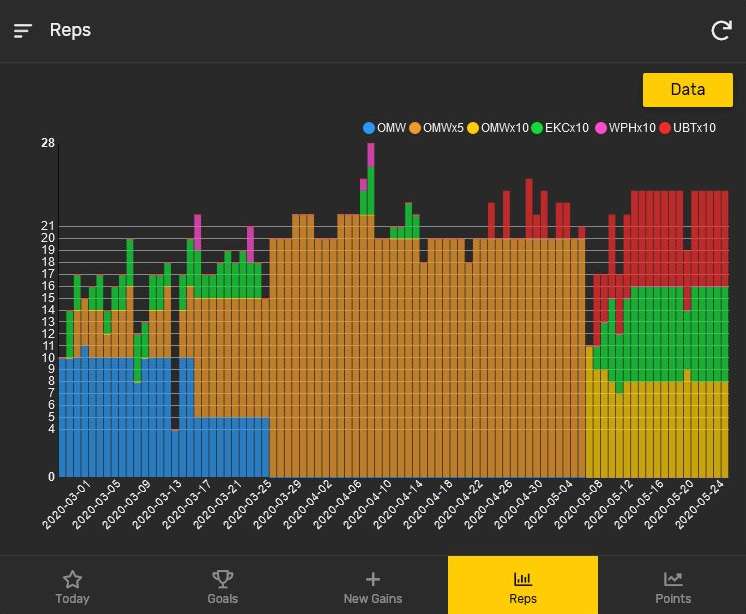
The design was around showing the key performance numbers, as well as the same types of charts and graphs in the desktop version, to highlight when daily goals are reached, and by how much.
Conclusion
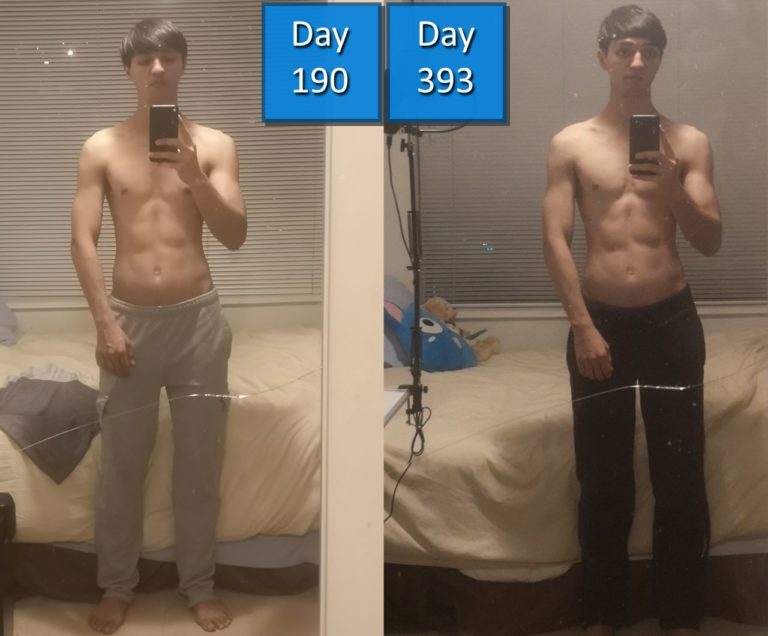
Sabian Got Results
With these new tools at his disposal, Sabian was able to monitor his performance and progress throughout his workouts, and seeing his numbers each week showed him the reality through his ups and downs, and it clearly paid off.